Now, the charts we are presenting on this website are to demonstrate what our algorithm does; we are not recommending or endorsing these investment instruments, nor are we limited to these examples. If you would like to see charts for other securities, please reach out to us via our contact page.
Before you view the real-time sample charts, we wouls like to go over how to read them.
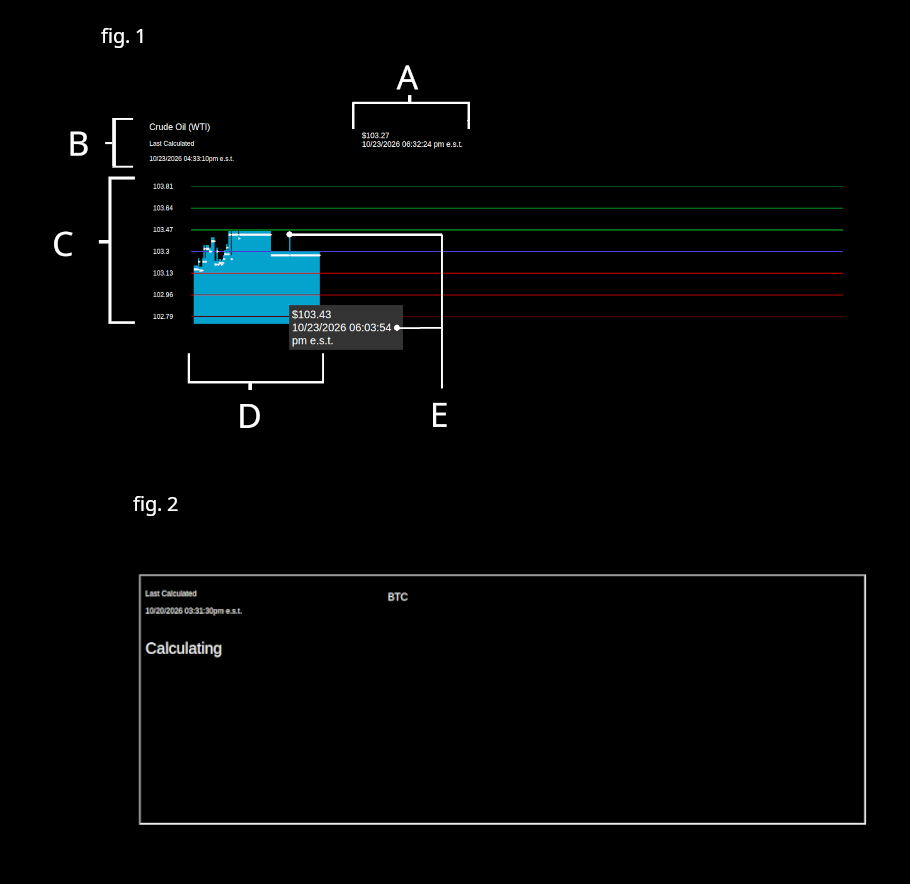
This (fig. 1) is an image of an actual chart from 10/23/2026 for Crude Oil (WTI), and is labeled to assist in reading the chart.
A. This shows the most current price along with the time and date tht price was recorded; this information is updated every 60 seconds.
B. This is the name or ticker symbol of the investment and the date and time the chart was calculated and created.
C. This is the range our algorithm has calculated for the investment in this session.
D. These bars here represent the price movements of the investment thus far. As you can see the price has exceeded the high several times. With the price exceeds the highest frecast, or fails to meet the lowest projection, it triggers monitoring for either rally or sell-off behavior. If price continues in either direction beyond the limits of the chart, this chart will imediately be archived and then recalcuated (see fig.2).
E. At the top of each colum on the graph is a white marker that shows the actual price=point; by clicking on each point a pop up is opened with the price and the time of each price.
All times on the charts are in Easter Standard Times (e.s.t.) to relect the market time.
To continue on to the actua charts, click here.